1. Global Gold Market Overview
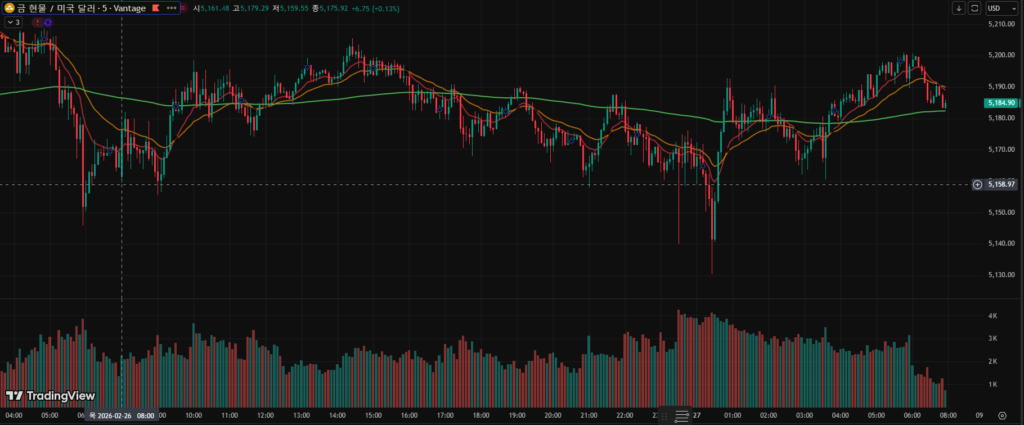
Analysis Period (KST): Previous 07:00 – Today 07:00
Key 24-Hour Figures
- Previous 07:00 Reference Price: $5,161
- 24H High: $5,205
- 24H Low: $5,130
- Price Just Before 07:00 Today: $5,184
Price Range: $75 ($5,205 − $5,130)
Percentage Change: +0.45% (($5,184 − $5,161) ÷ $5,161 × 100)
Gold opened the session at $5,161 and initially moved lower under selling pressure, testing the downside first.
Between 00:50 and 01:10 (KST), a sharp downside spike pushed price to $5,130, marking the 24-hour low. This move was accompanied by heavy volume, suggesting stop-loss liquidation and short-term position flushing.
However, strong dip-buying emerged at $5,130, triggering a rapid rebound. Price recovered into the $5,170–$5,190 range and stabilized within that intraday box.
During the 05:00–06:00 (KST) window, another upside attempt occurred. Gold briefly reached $5,205, setting the 24-hour high before encountering resistance and profit-taking near the top of the range.
The core structure of the session can be summarized as:
Downside spike → High-volume rebound → Retest of highs → Resistance confirmation
2. Market Reactions & Key Drivers
1) U.S. Yield Expectations – Reuters
U.S. Treasury yields reversed lower during the session, creating a supportive environment for gold. Reuters reported that dovish remarks from Federal Reserve officials softened short-term rate expectations.
Mechanism: Lower yields reduce the opportunity cost of holding gold → Increased demand.
Price Reaction: After 02:00 (KST), gold recovered from $5,150 toward the $5,180 region.
2) Dollar Weakness – Bloomberg
Bloomberg highlighted a pullback in the U.S. dollar index from short-term highs. A weaker dollar typically supports dollar-denominated assets like gold.
Mechanism: Dollar weakness → Relative value of gold rises.
Price Reaction: Between 04:00–05:00 (KST), gold advanced from $5,175 and attempted a breakout above $5,200.
3) Short-Term Volatility – CNBC
CNBC noted increased positioning adjustments ahead of macro events. Option-related hedging flows contributed to rapid price swings.
Mechanism: Option hedging flows → Sharp downside wick followed by aggressive rebound.
Price Reaction: Immediate recovery following the $5,130 low formation.
3. Short-Term Technical Perspective
- $5,130: Strong short-term support confirmed
- $5,200–$5,205: Immediate resistance zone
- Price holding near the 200-period moving average
- V-shaped recovery structure after the spike low
The current structure does not yet signal a confirmed trend reversal. Instead, it reflects a test of the upper boundary of a mid-term range.
A daily close above $5,205 would open room for renewed upside momentum.
Conversely, a break below $5,170 increases the probability of a retest toward $5,150.
4. Strategic Summary (Trader’s View)
The defining feature of this 24-hour session was the spike low that failed to develop into structural breakdown.
This suggests that dip-buying liquidity remains dominant over sustained selling pressure.
- $5,130 = Clear defense line
- $5,205 = Breakout confirmation level
- Range top breakout determines next directional move
Current structure: Successful dip buy → Failed breakout → Retest setup
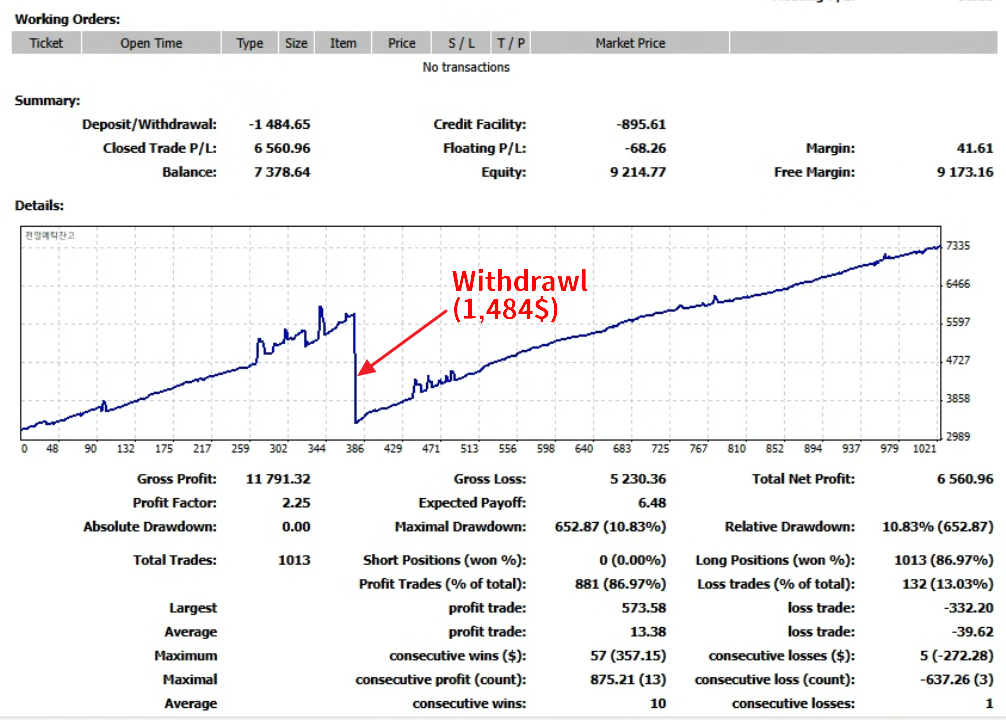
5. Gold Quant 24H Performance Report
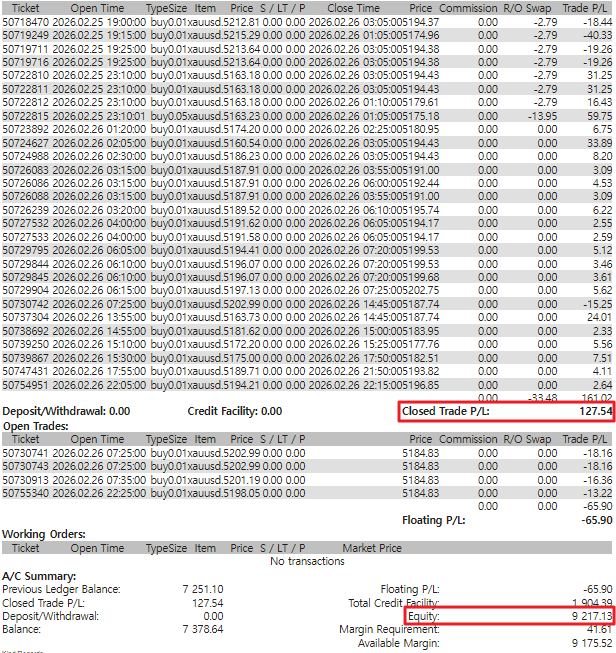
The Gold Quant account generated $127 profit over the last 24 hours.
Based on a $3,000 capital (including bonus), the 1-day return equals approximately 4.3%.
- 25.11.28 (Day 1): $2,657 (Starting Equity)
- 26.02.03: Withdrawal: $1,418
- 26.02.27 (Day 88): $9,217 (Current Equity)
- Total Net Profit: $6,560